Windows Azure Diagnostics
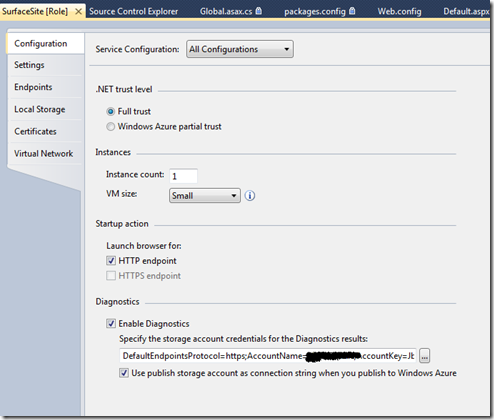
Diagnostics in any application is a necessity and Windows Azure applications are no different. You could remote desktop onto the instance and check the event logs and even run up debug view so that you can see your system diagnostic messages. There is however a mechanism provided to retrieve a whole load of diagnostic information. By enabling Windows Azure Diagnostics you can retrieve the diagnostic trace logs, windows event logs, performance counters and other useful data. Enabling Windows Azure Diagnostics can be done by setting the Enable Diagnostics check in the configuration of each Azure role. You also need to add a diagnostic connection string as follows:
This enables diagnostics but this alone will not provide you with any information. Windows Azure diagnostics works by capturing the data that you have requested and periodically transferring it to table or blob storage where you can view the information. The information can be requested by configuring the diagnostics you require either in code or in a config file. The config file resides in blob storage and can be changed at runtime so it make sense to use that configuration mechanism rather than code as it can be easily turned off when not in use.
Firstly you may want to retrieve your tracing information that is traced using System.Diagnostic.Trace. the easiest way to do this is to add a trace listener. The Windows Azure SDK contains one that can be used. this is called DiagnosticMonitorTraceListener. This can be added to the web.config file in the same way as other listeners or via code. When I added it to the web config file I had issue on certain projects where the Windows Azure Diagnostics assembly could not be found. Adding the configuration in code always seemed to work. As you will need to redeploy anyway to update your web config file in Windows Azure it makes little difference whether the configuration is in code or the web config file (except that you need to rebuild). In order to add it to code I added the following line to the global.asx.cs file:
1 1: void Application\_Start(object sender, EventArgs e)
2: {
1 3: // Code that runs on application startup
4: System.Diagnostics.Trace.Listeners.Add(new Microsoft.WindowsAzure.Diagnostics.DiagnosticMonitorTraceListener());
1 5: }
2```
3
4You now need to modify the config file located in blob storage. The config file is located in blob storage inside the wad-control-container. There will be a config file in here for each deployment you have made with diagnostics enabled and for each instance. You will need to update each instance you wish to receive diagnostic information from.
5
6Tracing can be enabled by modifying the following xml accordingly:
7
8```
9 1: <Logs\>
2: <BufferQuotaInMB>1024</BufferQuotaInMB>
1 3: <ScheduledTransferPeriodInMinutes\>5</ScheduledTransferPeriodInMinutes\>
4: <ScheduledTransferLogLevelFilter>Verbose</ScheduledTransferLogLevelFilter>
1 5: </Logs\>
2```
3
4This will transfer the logs at 5 minute intervals at the highest log level. You can change the level to be Information or Error which represents whether you have used TraceInformation or TraceError whereas Verbose traces both and using Trace.WriteLine. The logs will be transferred to table storage in a table called “WADLogs”
5
6Performance counters can be configured as follows:
7
8```
9 1: <PerformanceCounters\>
2: <BufferQuotaInMB>0</BufferQuotaInMB>
1 3: <ScheduledTransferPeriodInMinutes\>5</ScheduledTransferPeriodInMinutes\>
4: <Subscriptions>
1 5: <PerformanceCounterConfiguration\>
6: <CounterSpecifier>Processor(_Total)% Processor Time</CounterSpecifier>
1 7: <SampleRateInSeconds\>30</SampleRateInSeconds\>
8: </PerformanceCounterConfiguration>
1 9: <PerformanceCounterConfiguration\>
10: <CounterSpecifier>MemoryAvailable Bytes</CounterSpecifier>
1 11: <SampleRateInSeconds\>30</SampleRateInSeconds\>
12: </PerformanceCounterConfiguration>
1 13: </Subscriptions\>
14: </PerformanceCounters>
1
2This will transfer the processor percentage and available bytes every 5 minutes with a 30 second sampling frequency. These are stored in table storage in a table called “WADPerformanceCountersTable”. Information about the performance counters that are available can be found [here](http://blogs.msdn.com/b/avkashchauhan/archive/2011/04/01/list-of-performance-counters-for-windows-azure-web-roles.aspx):
3
4Event logs can be configured as follows:
1: <WindowsEventLog bufferQuotaInMB="0"
1 2: scheduledTransferLogLevelFilter\="Verbose"
3: scheduledTransferPeriod="1">
1 4: <!-- The event log name is in the same format as the imperative
5: diagnostics configuration API -->
1 6: <DataSource name\="Application!\*" />
7: <DataSource name="System!*" />
 1 8: </WindowsEventLog\>
 2```
 3
 4These are stored in a table called “WADWindowsEventLogsTable”.
 5
 6Further information can be found at:
 7
 8[Example configuration file](http://msdn.microsoft.com/en-us/library/windowsazure/hh771389.aspx#bkmk_AppF)
 9
10[Overview of Storing and Viewing Diagnostic Data in Windows Azure Storage](http://msdn.microsoft.com/en-us/library/windowsazure/hh411548.aspx)
